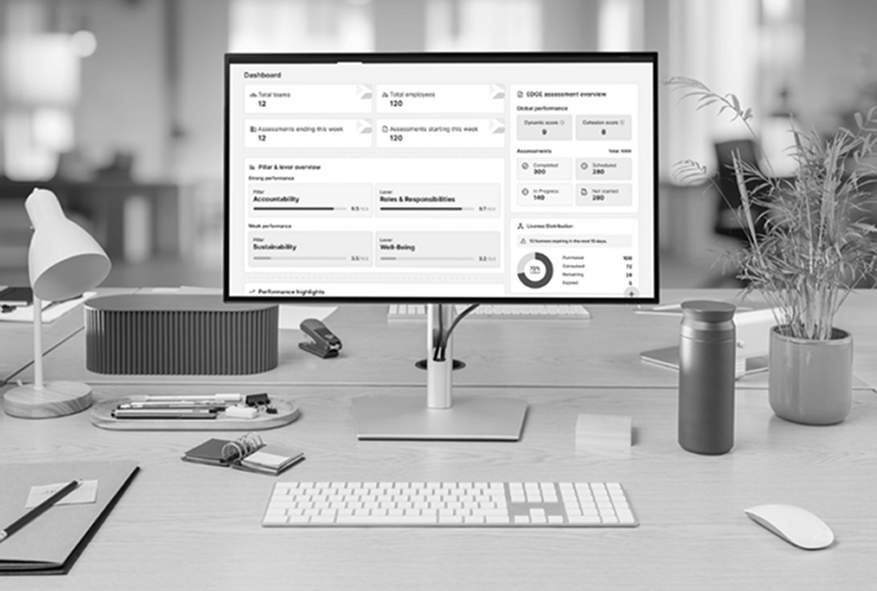
See what actionable team insights look like

A clear view of your team across 10 performance pillars and 35 behavioral levers.
A 30 page report report is generated once the assessment is complete - designed to help you:


See where your team is aligned - and where experiences diverge
The report reveals how consistently your team is experiencing the same environment - highlighting where alignment is strong, where it varies, and where deeper divides may exist beneath the surface.

Interpret scores with clarity
See whether your team is aligned - or experiencing the same environment in very different ways. This helps surface hidden variation that can mask friction or disconnect.

Protect anonymity while revealing patterns
All responses are anonymized and combined into team-level patterns - ensuring individual privacy while still making meaningful differences visible.

Enable more informed conversations
See beyond high-level scores to the specific behaviors and conditions shaping performance - so you can ask better questions and take targeted action.
Move from participation to clarity without delay
As soon as your team completes the assessment, your report is ready - giving you a clear, structured view of how your team is actually working, and where to focus next.
What You'll See in the Report

A structured view across all performance pillars
See how your team is performing across 10 pillars and 35 behavioral levers.

Where alignment is strong - and where it varies
Range-based views highlight consistency, gaps, and differences in team experience.

Patterns that add context to the scores
Anonymous response patterns reveal what sits beneath the numbers.

Clear interpretation of what the results mean
Pillar-level insights explain what low scores indicate in your team’s context.

Overall indicators of team dynamics and cohesion
Understand how your team is functioning as a system, not just in parts.

Targeted recommendations and deeper insight
Identify where to act next, supported by clear considerations and data correlations that show what’s driving performance.
The report is designed to give leaders a clear, practical understanding of team dynamics, combining summary views with deeper context to support meaningful action.
The report is built to help leaders move beyond assumptions - and focus on what matters most right now.
Whether that’s strengthening alignment, improving communication, sharpening priorities, or sustaining performance over time.
Measure what’s changed - and what hasn’t
Compare results over time to see where performance has improved, where it’s plateaued, and where attention is still needed. A simple way to track progress, reinforce gains, and demonstrate return on investment.
Track Progress
Easily compare results over time to understand what’s improved and what hasn’t. Stay informed with clear performance insights.
Identify Trends
Spot areas of growth, plateaus, and opportunities for improvement. Make smarter decisions with data-driven clarity.
Prove Impact
Demonstrate measurable outcomes and return on investment. Show the real value of your efforts with confidence.
Stay Consistent
Regular reassessments help you stay on track and maintain momentum. Keep a continuous pulse on team performance.


We recommend reassessing regularly to keep a pulse on team performance.